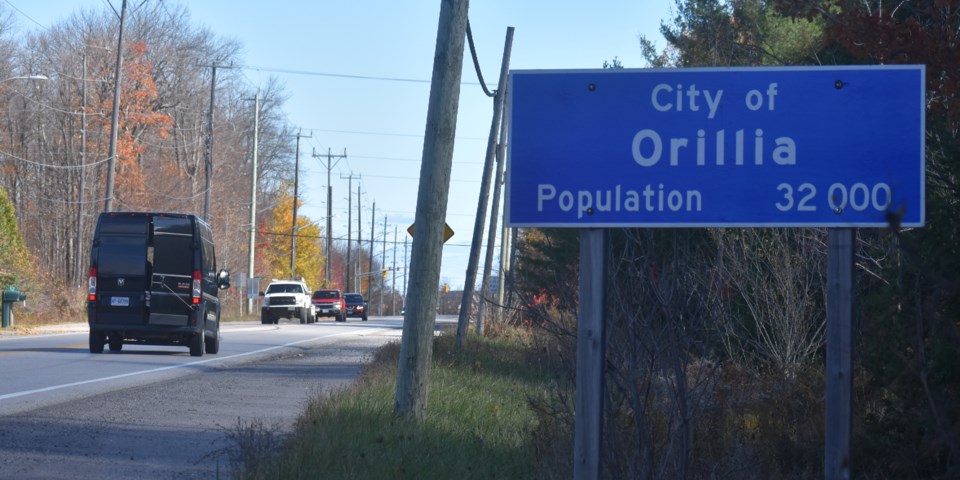
Did you know almost half of people who live in Orillia do not consider themselves religious? How many people immigrated to Orillia over the last five years? How many people live in highrise apartments in the Sunshine City?
These and many are questions were answered this week when Statistics Canada released its latest Census data.
According to the information released Wednesday, Orillia’s population grew by more than 7 percent — or by more than 2,000 people — from 2016 to 2021.
The city’s population rose from 31,166 in 2015 to 33,411 in 2021, the stats show. That makes Orillia the 57th largest city, by population, in Ontario.
The city’s surrounding townships also grew.
Ramara’s population in 2016 was 9,488. It grew by 9.4 per cent to 10,377 in 2021.
Severn’s population in 2016 was 13,462. It grew by 8.3 per cent to 14,576 in 2021.
Oro-Medonte’s population in 2016 was 21,036. It grew by 9.4 per cent to 23,017 in 2021.
According to the numbers, women outnumber men in Orillia. The Census notes there are 15,685 men and 17,730 women.
The average age of “the population” in Orillia is 45.8.
There are 20,095 people in Orillia — or just over 60 percent of the population — within the age range from 15 to 64; there are 4,645 people 14 and under.
There are 8,670 people in Orillia, or about 26 per cent of the city’s population, who are 65 and older — including 645 who are 90 years old or older.
Among the four-year blocks, the five largest are:
- 60 to 64 - 2,620
- 55 to 59 - 2,465
- 65 to 69 - 2,335
- 30 to 34 - 2,275
- 25 to 29 - 2,175
When it comes to housing, a little more than 8,000 people live in single, detached dwellings while 355 live in semi-detached dwellings.
According to the stats:
- 1,245 people live in a row house;
- 910 people live in a duplex;
- 2,755 citizens live in an apartment with fewer than five storeys;
- 920 people live in an apartment with more than five storeys; and
- 165 live in mobile homes.
On average 2.2 people live in each residence.
Of the 28,765 people 15 and over, 14,740 are married or live in a common-law relationship while 14,025 are not married or not living in a common-law relationship.
Of the 5,350 married couples in Orillia, 2,200 have children while 3,155 do not have children. Of the 1,825 common-law couples in Orillia, 760 have children while 1,065 do not have children.
There are 2,105 one-parent families in the city; the parent is a woman in 1,690 families and the parent is a man in 420 families.
The median total income in Orillia was $37,200 in 2021. The stats show 1,730 people made more than $100,000 in 2021, while 1,275 people earned between $100-149,000 and 455 made $150,000 or more.
In 2020, the median after-tax income of households in Orillia was $64,000, an increase of 17.6% from $54,400 in 2015. The median after-tax income of households in the surrounding three townships were significantly higher. They are, as follows:
- Oro-Medonte - $98,000
- Severn - $83,000
- Ramara - $75,000
According to the Census, 8,075 people in Orillia received COVID-19 emergency and recovery benefits in 2020.
When it comes to religion, in 2021, the top religious group was Catholic, with about 5,660 persons representing 17.5% of the total population. The second group was “other Christians,” with about 3,460 persons representing 10.7% of the total population. The population who declared no religion and secular perspectives numbered 15,325 persons, representing 47.5% of the total population.
In 2021, there were 1,975 Indigenous people in Orillia, making up 6.1% of the population.
Within the First Nations population, 62.4% (815) had Registered or Treaty Indian status, as defined under the Indian Act. The other 38.0% (500) of the First Nations population did not have Registered or Treaty Indian status.
Data about immigration was also included in the Census. It shows 280 people immigrated to Orillia between 2016 and 2021, which is 80 more than the previous five-year period.
Of those, 65 are from the Americas — including 15 from Brazil and 15 from the U.S.
There were also 15 people from the United Kingdom who made their way to Orillia.
But the largest group was the 195 citizens from Asia, including:
- India - 65
- Philippines - 45
- South Korea -15
- Syria - 10
Just over seven percent of the city’s population - or 2,375 people — are visible minorities. The largest are as follows:
- South Asian - 590
- Black - 405
- Filipino - 360
- Chinese - 345
- Southeast Asian 155
When it comes to ethnic or cultural origin, 5,925 identify as Canadians, while 10,370 are English, 7,720 are Irish, 8,195 are Scottish, 3,425 are French, 3,105 are German, 1,815 are British Isles, 1,640 are Dutch, 1,600 are Italian — among the largest groups.
Since the previous Census in 2016, 16,245 in Orillia have not moved; they live at the same address. And, 14,475 people have moved within those five years.
The land area of Orillia is 28.53 square kilometres and the population density was 1171.1 people per square kilometre.
