Orillia is not growing as fast as other comparable municipalities, is home to more seniors than most communities and the average gross household income of its citizens is the lowest in the region.
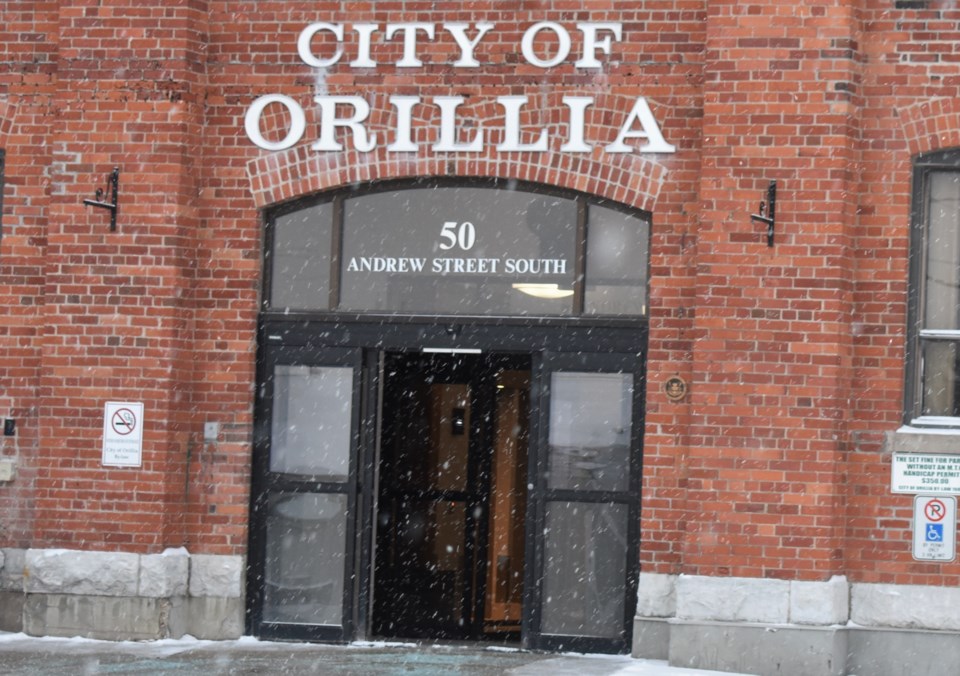
Those are among the findings of the comprehensive BMA Municipal Study (based on 2016 data) that was presented to city councillors Monday night at a council committee meeting at city hall. The study, a 521-page document, identifies both key quantifiable indicators and certain qualitative measures that impact a local municipality’s financial condition.
BMA Consulting annually prepares the report that compares various financial data from participating municipalities. While Treasurer Jim Lang said there are “limitations to the study”, he said it’s a useful tool to gauge how the city fares in some key areas.
Mayor Steve Clarke agreed. “It’s a great benchmark,” he said, praising the city’s financial situation. “I will point out that of the 15 different tax categories, in two we are high and eight, we are in mid and five we’re low.”
To “mitigate the difference with local factors”, staff used the Simcoe/Muskoka/Dufferin area – comprised of Bracebridge, Orillia, Orangeville, Huntsville, Springwater, Gravenhurst, Barrie, Innisfil, Oro-Medonte and Collingwood – as the group it compared itself to.
According to the study, Orillia’s population increase is lower than the average population increase in that region. Orillia has had a modest population growth and experienced an increase in population of 30,586 in 2011 to 31,166 in 2016 (1.9% increase), markedly lower than the 5.2% average population climb of communities in the comparator group.
Orillia has a slightly higher proportion of seniors compared to the comparator group average. According to the data, 24% of Orillia residents are 65 and over compared with the Simcoe/Muskoka/Dufferin average of 20%; the provincial average is 17%.
The city’s relative construction activity demonstrates “a good mix between both the residential and commercial sector”, staff noted in a summary of the study. Orillia’s building permit activity per capita, has increased above the comparator group’s three-year average.
However, the average gross household income in Orillia is the lowest in the comparator group. Household income in Orillia may be lower than average due to the fact that Orillia has a higher number of retirees on fixed income. However, retirees often have more disposable income due to lower household costs. The average annual household income of all surveyed municipalities in the BMA study was $97,627; Orillia’s estimated average annual household income was $73,844 – more than $24,000 below the average. As a comparison, Barrie was $93,878, Oro-Medonte was $119,178 and Springwater was tops ($138,346)
In the good news category, Orillia’s taxes are significantly lower than average in several classes. In Orillia, the majority of property classes rank “low” to “mid” compared to the average taxes for comparable properties. Orillia ranked the 25th lowest in the standard industrial class. The large industrial and motel classes are two exceptions to these lower-than-average results.
Reserves are below the comparator group average. Although the ratio improves year over year, indicating the city is taking action to reduce the gap, 2016 reflects a further increase to the gap due to major capital construction projects funded through reserves.
Debt outstanding has been decreasing over the years as payments are being made. Total debt per capita is also below the survey average, thus indicating although Orillia's population is increasing, the city is in a good financial position, staff conclude. “The City of Orillia’s total debt outstanding per capita is $386, which is significantly less than the survey average of $769.” The city ranked 28th out of 94 municipalities surveyed within the 2017 BMA study.
In terms of what Orillia is paying for services – compared to other municipalities with a population of 30,000 to 99,999 – this is where the Sunshine City ranks. In terms of “contracted” services, all are ranked “low” with the exception of assistance to aged (high) and child care (mid)
- Police $221 per capita (average is $271)
- Transit is $36 (average is $56),
- Waste collection is $6 (average is $11)
- Public health is $12 (average is $24)
- Ambulance $50 (average is $54)
- ODSP is $40 (average is $65)
- Assistance to aged is $38 (average is $27)
- Child care is $19 compared to average of $27.
As for the cost of “non-contracted services” seven are ranked high, two are considered mid and two are low:
- General government per capita is $89 (survey average is $115)
- Fire is $222 (average is $170)
- Paved roadways is $18 (average is $97)
- Waste disposal is $17 (average is $7)
- Waste diversion is $36 (average is $24)
- Parks is $61 (average is $46)
- Recreation programming is $25 (average is $21)
- Recreation facilities is $41 (average is $75)
- Culture is $50 (average is $15)
- Library is $79 (average is $46)
- Planning is $24 (average is $19).
